Drive value-based decisions.
Analyse and evaluate social value with ease. Impact helps you map out the connections between activities and outcomes to develop a collective sense of what good looks like for your Impact reports.
01. COMPARE, CONTRAST, EXPLORE & ANALYSE
Talk the language of Impact, not just feel-good metrics
Producing information that is easily understood and transferable across settings can be difficult especially when it’s something as important as your impact.
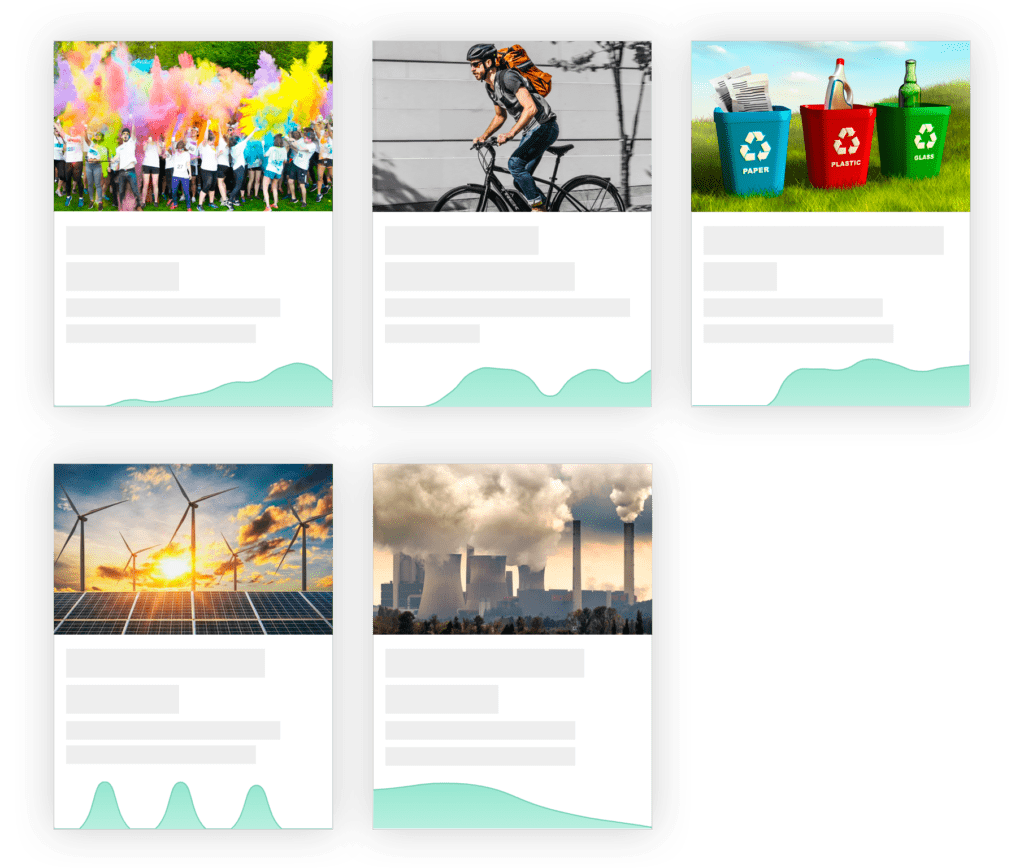
Our social value evaluation and analytics tools help you drill into all types of data captured to identify and understand how your actions are driving change and improvement on a beneficiary level and what that looks like, instead of just numbers and values.
02. LET THE HUMAN STORIES SHINE THROUGH
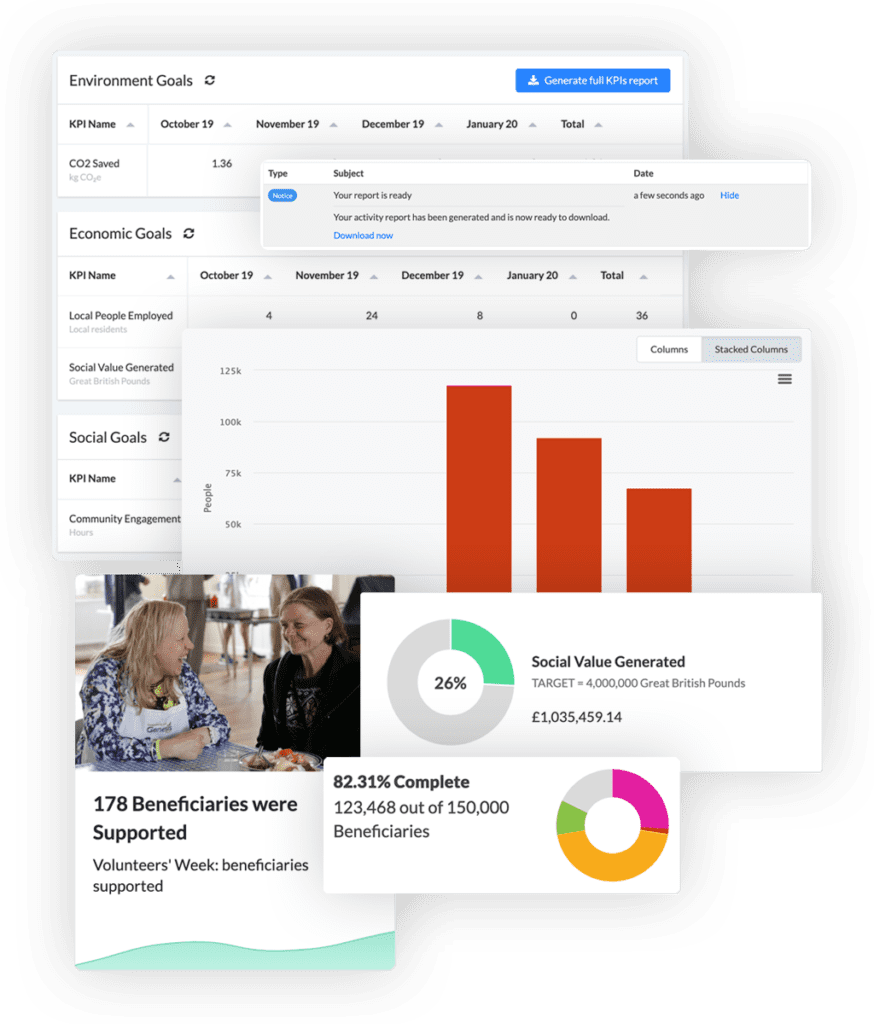
Dashboards that show a diversity of perspectives and experiences
Customisable views and layouts of various dashboards within Impact let you clearly see the data and outcomes that matter to you most. Easily navigate between different KPIs, activities, and initiatives, applying filters to locate what you need, hide what you don’t and unlock hidden meaning for your social value reports.
03. FIND THE ANSWERS YOU’RE LOOKING FOR
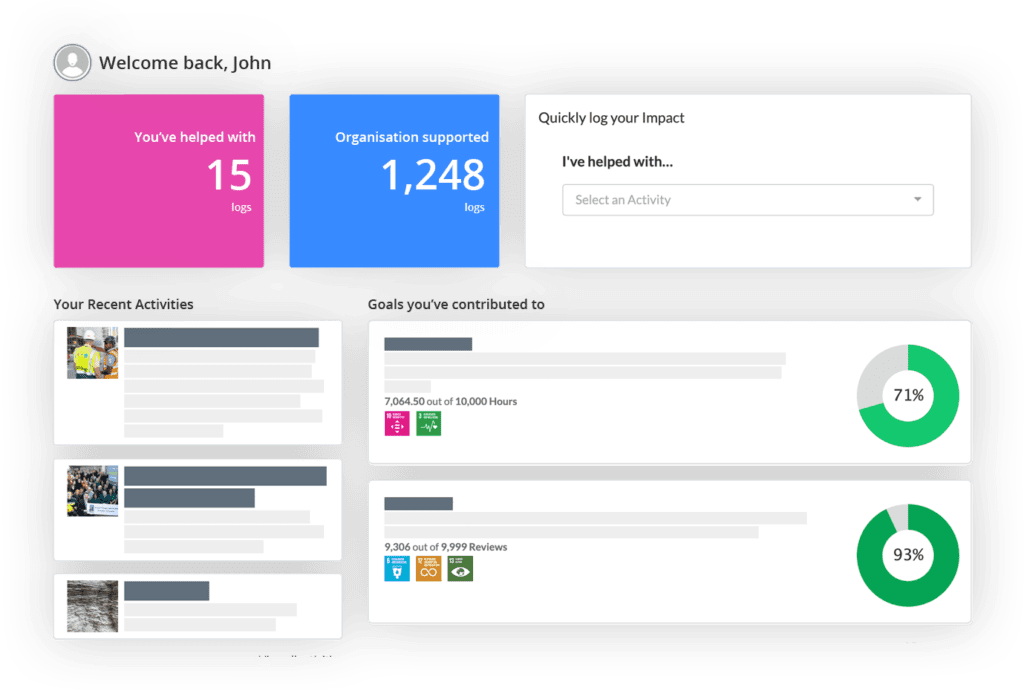
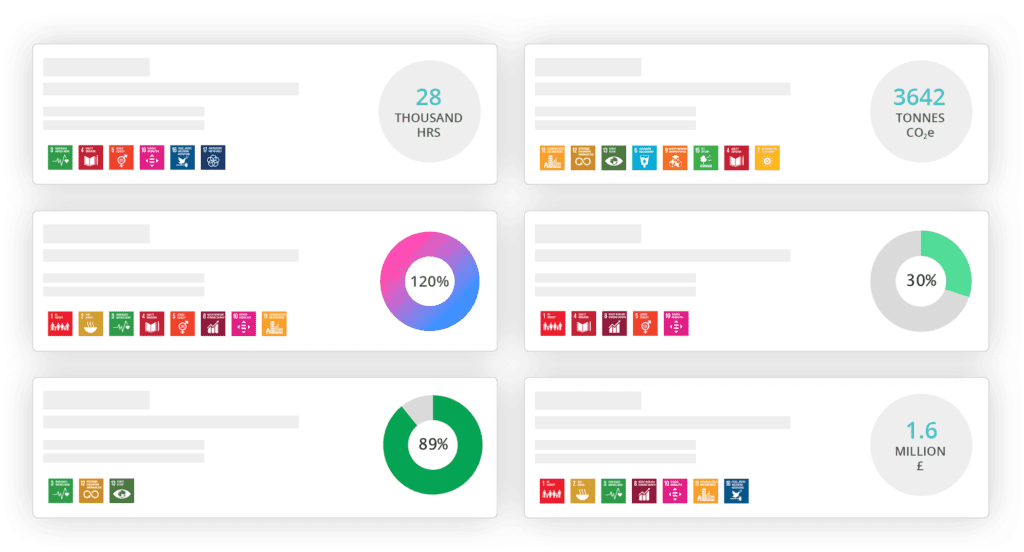
Visual indicators that provide a plethora of insight
Get a real sense of how far changes to beneficiaries and communities are attributable to your activities. Visual charts, graphs and responses make analysing high-level results a breeze, giving you the clarity, richness and depth you need to add meaning to your impact reports.
Furthermore, our survey dashboard provides you with a birds-eye view of your feedback and lets you quickly present detailed insights to stakeholders in a simple and elegant way.
04. FOCUS ON WHAT’S IMPORTANT
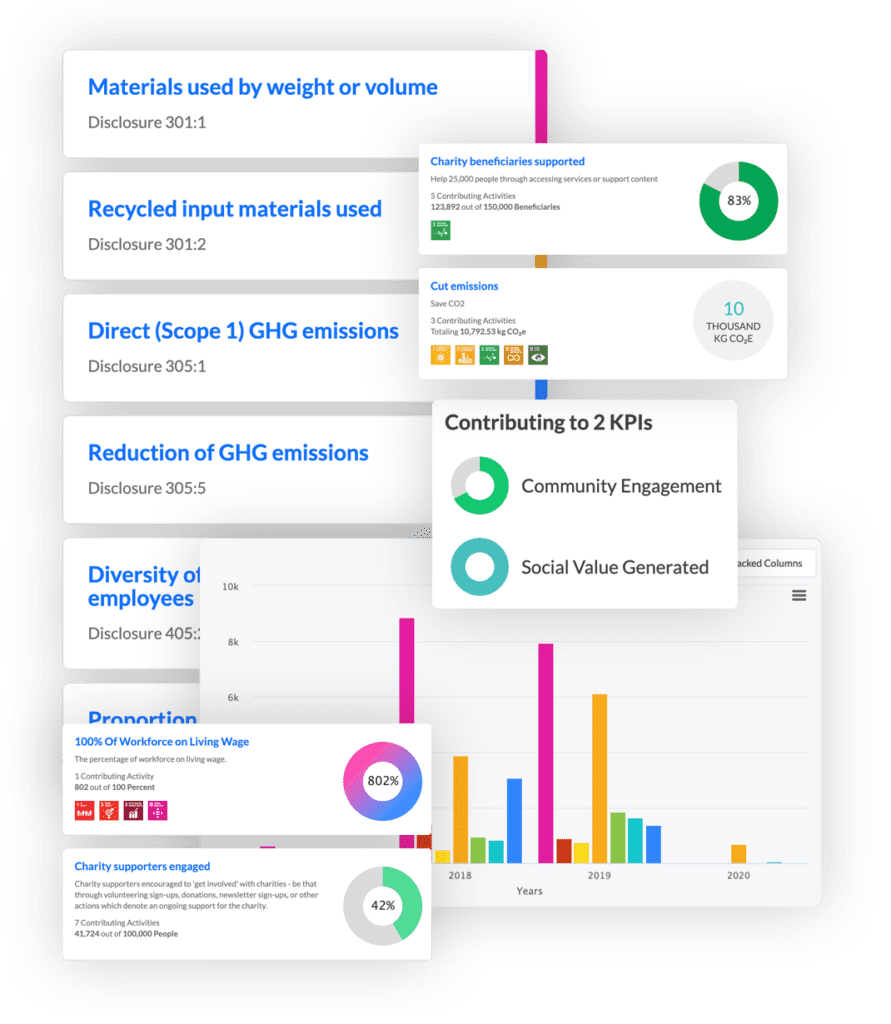
Map activities to organisation-wide goals and KPI’s
Good intentions get lost in calculations. Our evaluation tools let you turn your attention to how you can integrate concern for impact in future decision making.
Goal and KPI overviews map the connections between activities and outcomes to providing an easy way to see how changes are attributable to your activities, helping stakeholders develop a collective sense of what good looks like and what might need more attention.
05. ALWAYS UP-TO-DATE REPORTS FOR STAKEHOLDERS
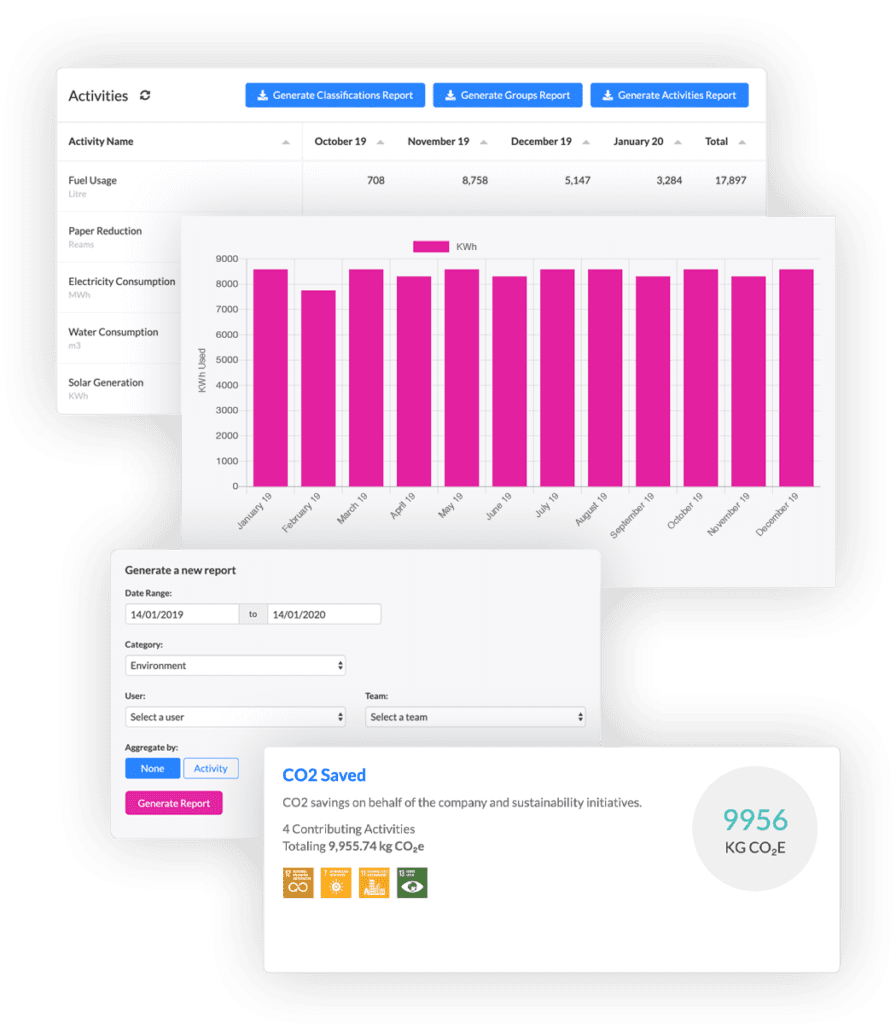
Generate fuss-free reports in seconds
Impact’s built-in reporting functionality brings together all the evidence you need to show the cause and effect of your activities and prove your progress towards meeting your goals.
You can easily download charts and graphs to show a visual representation of your progress or export the raw qualitative and quantitative data for deeper analysis or evidence.
Get more than just social value evaluation tools
Everything you need to measure and evaluate the social value and impact of your organisation from one cloud-based tool.
